
Choose your JVM
Select a local Java process and attach the native profiling engine. Control CPU profiling and memory tracking from the same workspace.
Java performance, in focus
Go from a slow Java application to the methods and allocations behind it. CPU hotspots, memory origins and saved snapshots, in one focused desktop profiler.
Windows & Linux Native JVMTI engine
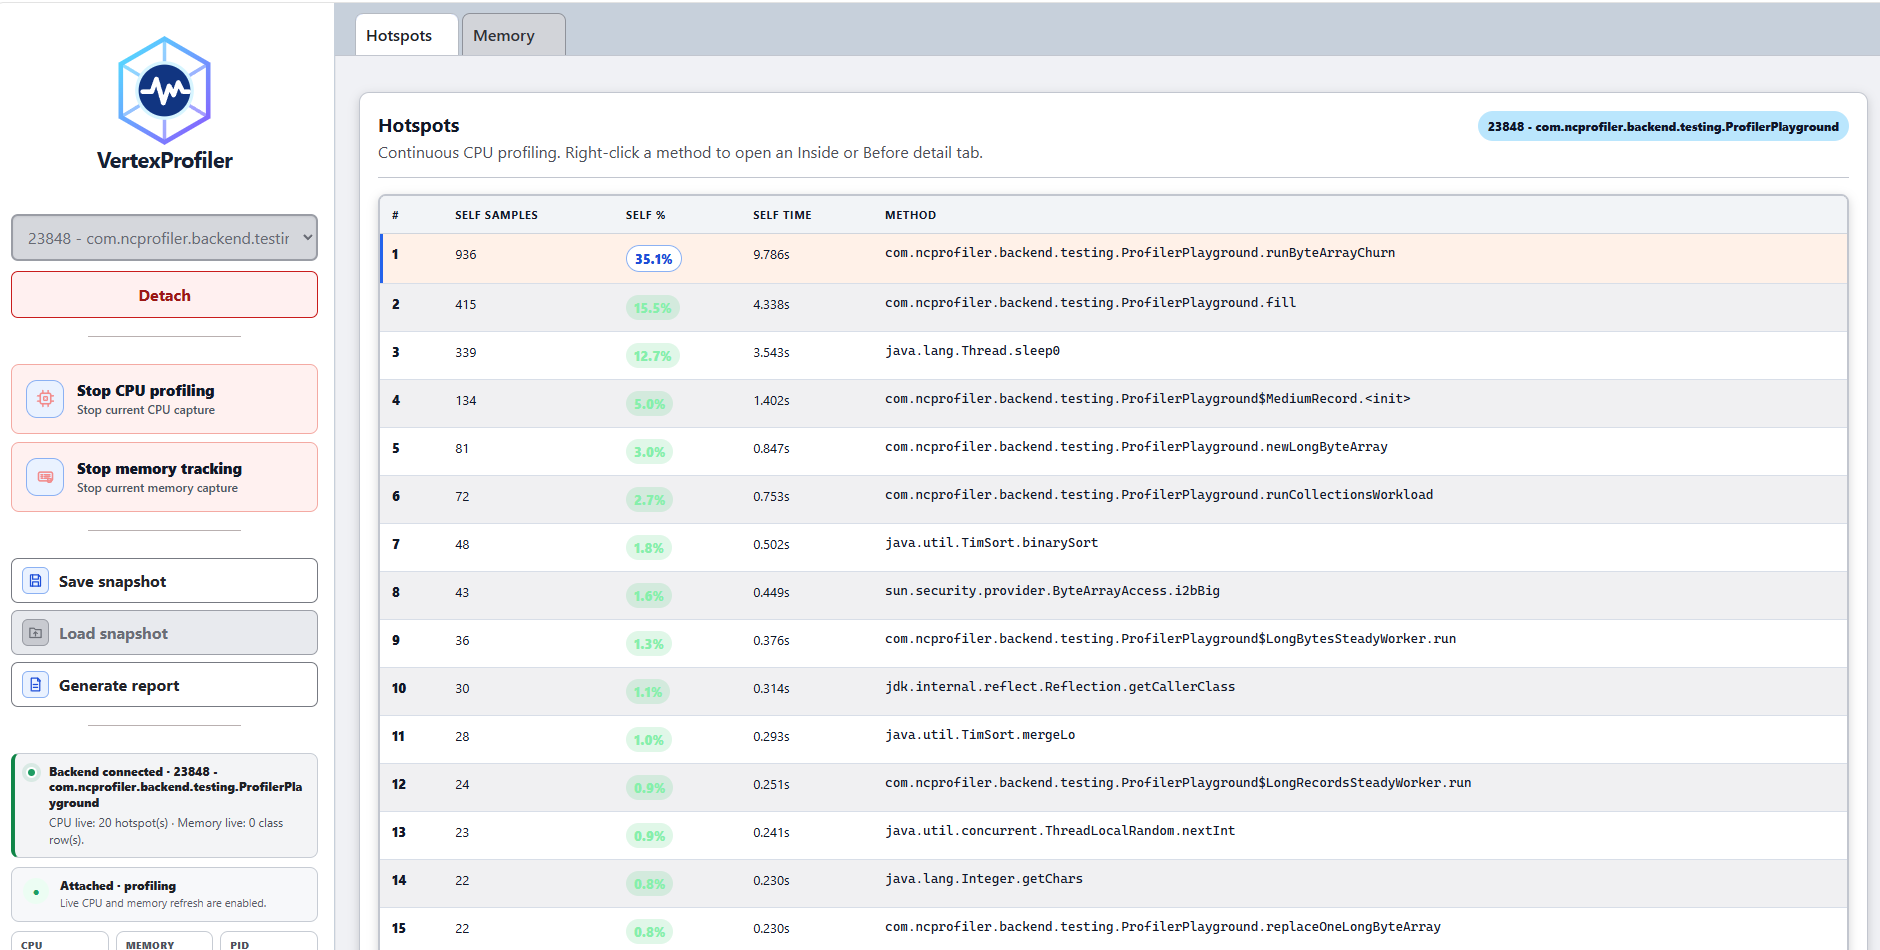
From symptom to source
Start with a running JVM. Follow the CPU and memory evidence. Keep a record of what you found.
Select a local Java process and attach the native profiling engine. Control CPU profiling and memory tracking from the same workspace.
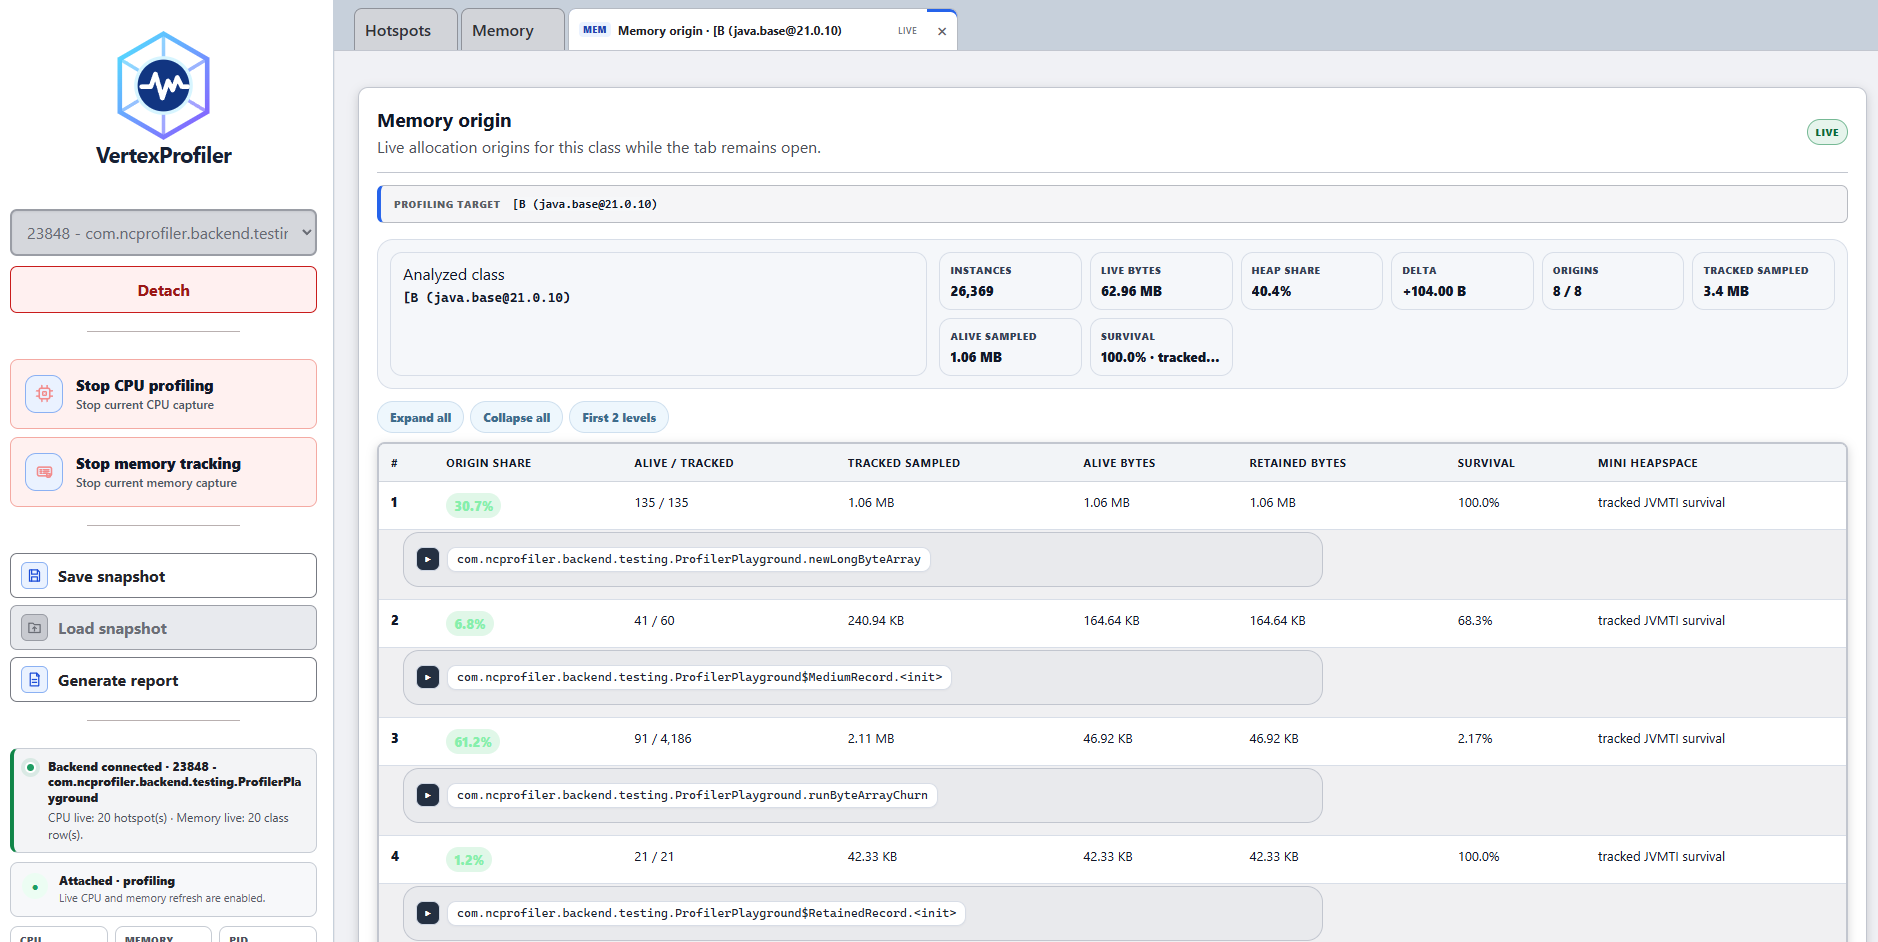
Rank CPU hotspots, inspect method detail and trace memory allocations back to their origins.
Save a snapshot to revisit a capture, or generate a report to share the investigation with your team.
CPU profiling
See self samples, relative cost and self time side by side. Open method detail from a hotspot to investigate its context.
Memory investigation
Inspect a class, follow its allocation origins and examine tracked object survival. Put memory usage back into the context of your code.
Before you start
CPU hotspots and memory behavior in a local Java application, including allocation origins and tracked object survival.
VertexProfiler is packaged for Windows x64 and Linux x64. Check Downloads for available release packages.
You can save and load snapshots, and generate reports from the desktop application.
Individual covers one activation. Team covers up to five activations. See Pricing for the annual plans and purchasing availability.
Your next investigation
Explore the desktop application and choose the licence that fits your work.